


Heading will come here
View NowMutual Funds
- ICICI Prudential Advisor Series - Dynamic Accrual Plan 31.85 0.00(0.00%)
Equities Indices
Nifty 50
|
10,195.15 10.2600 (-3.3%) 16-03-2018 12:00 |
Prev Close 10,360.15 | Open 10,345.15 | High 10,346.30 | Low 10,180.25 | Details |
Equities
Asian Paints Ltd.(INE021A01026)
| NSE: Asian Paints | BSE: 500820 | Sector: Chemicals |
|
NSE Mar 16 2018, 4:01 1,160.80 23.90(+3.90%) |
BSE Mar 16 2018, 4:01 2,260.90 23.90(+3.90%) |
View Details |


DIY Portfolio
The intelligent, simplified, rapid and costless way of creating your portfolio
With DIY Portfolio @ InvestOnline.in you can plan for your investment favourably in less than 2 minutes... Yes, you read it correct, less than 2 minutes.
Why DIY Portfolio?
Investment Overview
-
 Investment Cost10,203,530
 -
 Current Value13,254,322
 -
 Total Gain/Loss3,050,792
 -
 Today's Gain11,236
Having created your personalised financial plan based on risk and returns you are comfortable with; create a portfolio of funds that suit your life goal objectives without being pressured into selecting funds or fund houses that do not offer you the level of comfort required. With the information available on the IOL site, an objective selection of funds becomes easy. The best part is that you could create a simulated portfolio and track its performance and fine-tune your selection before making an actual purchase decision, be it a single buy or at regular intervals. The selected funds are populated into a table grid containing the cost and current value, period held, gain accrued, with a buy/sell switch for action at the right time.
Create as many DIY portfolios as you like and let the easy to read the Investment Overview keeps you updated on how your consolidated portfolio is performing.

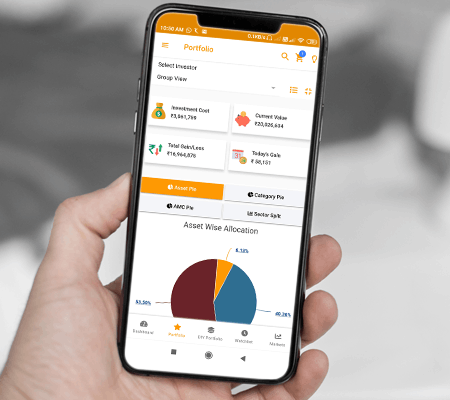
Graphical Overview
Asset Allocation
Get a snapshot view of how your money has been invested across asset classes through the funds acquired in your portfolio. Equity, debt, gold, cash and other newer classes of assets held are displayed in a pie chart with an ability to further dissect each asset class; say small cap, mid cap, large cap in equity or short medium or long term debt.

Fund House Allocation
Get to know what each fund house selected by you is cross betting on in terms of funds of other houses selected by it within a certain scheme it has put together. It's the best way of deriving comfort for your decisions to allocate higher amounts on one scheme over the other.

Sector Chart
While the primary selection of assets has been left to the fund house and fund manager, would it not be nice to know if your money has been spread judiciously across sectors or is vested heavily on a few? There are times when money should be bullish on sectors while at others spread itself across the board, or even avoid certain segments. The sector chart is a window into making such analysis.

Proceed To Complete Registration
Step 1
Personal Details
Step 2
FATCA Details
Step 2
Bank Details


Select Investment Type

Lumpsum

SIP
Equity
Select a scheme to add:
Select a scrip to add:


